L'utile netto totalizzato dal gruppo armatoriale OMI Corporation nel terzo trimestre di quest'anno è stato di 7,5 milioni di dollari, contro 22,4 milioni nello stesso periodo del 2000. Nei primi nove mesi del 2001 l'utile netto è ammontato a 75,6 milioni di dollari, contro 21,7 milioni nel corrispondente periodo del 2000. L'utile netto totalizzato dal gruppo armatoriale OMI Corporation nel terzo trimestre di quest'anno è stato di 7,5 milioni di dollari, contro 22,4 milioni nello stesso periodo del 2000. Nei primi nove mesi del 2001 l'utile netto è ammontato a 75,6 milioni di dollari, contro 21,7 milioni nel corrispondente periodo del 2000.
Il presidente e amministratore delegato della OMI Corporation, Craig H. Stevenson Jr., ha motivato il calo accusato nel periodo luglio-settembre dalla compagnia, che opera nel settore cisterniero, con i tagli alla produzione di greggio decisi dall'OPEC e con il rallentamento generalizzato dell'economia mondiale.
Stevenson prevede che la situazione non migliorerà nei prossimi mesi.
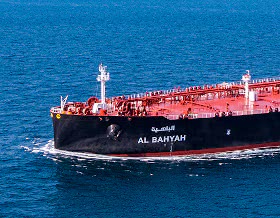
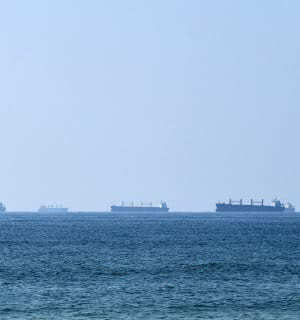
La flotta delle OMI Corporation è formata da 29 navi per un totale di 2,1 milioni di tonnellate di portata lorda e consta di sei Suezmax, tre Panamax, diciannove Handysize e Handymax e una ultra large crude carrier (ULCC). |
OMI Corporation
Crude Oil Fleet
| Name of Vessel | Type of
Vessel
| Year
Built | Dwt
| Charter
Expiration |
| SETTEBELLO | ULCC | 1986 | 32,466 | SPOT |
| COLUMBIA (A) | Suezmax |
1999 | 157,327 | SPOT |
| PECOS | Suezmax | 1998 | 157,406 | SPOT |
| SABINE | Suezmax | 1998 | 157,332 | SPOT |
| SACRAMENTO | Suezmax | 1998 | 157,411 | SPOT |
| SOMJIN | Suezmax | 2001 | 160,183 | SPOT |
| SOYANG | Suezmax | 2000 | 157,327 | SPOT |
| ELBE | Panamax | 1984 | 66,800 | SPOT |
| NILE | Panamax | 1981 | 65,755 | SPOT |
| VOLGA | Panamax | 1981 | 65,689 | SPOT |
| BANDAR AYU | Handysize |
1993 | 36,345 | 7/2005 |
| TANDJUNG AYU | Handysize |
1993 | 36,362 | 5/2005 |
| | | 1,540,403 | |
Clean Fleet
| NECHES | Handymax | 2000 | 47,052 | 9/2004 |
| GUADALUPE | Handymax | 2000 | 47,037 | 11/2004 |
| MARNE | Handysize | 2001 | 37,230 | 9/2004 |
| MADISON | Handysize | 2000 | 35,828 | 9/2006 |
| TRINITY | Handysize | 2000 | 35,800 | 10/2006 |
| RHONE | Handysize | 2000 | 35,775 | 4/2004 |
| CHARENTE | Handysize | 2001 | 35,751 | 9/2004 |
| SEINE | Handysize | 1999 | 35,407 | 7/2004 |
| ISERE | Handysize | 1999 | 35,438 | 9/2004 |
| LIMAR | Handysize | 1988 | 29,999 | SPOT |
| PATRICIA | Handysize | 1984 | 29,974 | SPOT |
| PAULINA | Handysize | 1984 | 29,992 | SPOT |
| RACER | Handysize | 1989 | 29,998 | SPOT |
| RAIN | Handysize | 1990 | 29,998 | SPOT |
| SEVERN | Handysize | 1988 | 29,998 | SPOT |
| SHANNON | Handysize | 1991 | 29,999 | SPOT |
| ALMA | Handysize | 1988 | 29,996 | 6/2003 |
| | | 585,272
| |
| Total Current Fleet | |
| 2,125675 |
|
Vessels Ordered
| Name of Vessel | Type of
Vessel
| Date to be
delivered |
Dwt | Charter
Expiration
|
| ASHLEY | Handysize | 11/2001 | 37,000 | 11/2004 |
| OHIO | Handysize | 12/2001 | 37,000 | 12/2004 |
| AMAZON | Handymax | 1/2002 | 47,000 | 1/2005 |
| SAN JACINTO | Handymax |
3/2002 | 47,000 | 3/2005 |
| MOSELLE | Handymax | 2/2003 | 47,000 | 2/2006 |
| ROSETTA | Handymax | 3/2003 | 47,000 | 3/2006 |
| ORONTES | Handysize | 3/2002 | 37,000 | 3/2005 |
| DAKOTA | Suezmax | 9/2002 | 159,000 | SPOT |
| DELAWARE | Suezmax | 10/2002 | 159,000 | SPOT |
| OTTAWA | Panamax | 4/2003 | 70,100 | SPOT |
| TAMAR | Panamax | 5/2003 | 70,100 | SPOT |
| | |
757,200 | |
| Total Fleet with Vessels On Order | | 2,882,875 |
|
(A) Vessels Chartered-InFinancial information
| For the three months
ended September 30,
| For the nine months
ended September 30,
|
| RESULTS OF OPERATIONS | 2001
| 2000 | 2001 |
2000 |
| (In thousands except per share data) (Unaudited) |
| Voyage Revenues | $ 45,134 |
$ 54,855 | $ 160,788 | $ 122,055 |
| Voyage Expenses | 8,219 |
7,264 | 21,892 | 18,219 |
| Operating revenues (TCE revenues) | 36,915 | 47,591 | 138,896 | 103,836 |
| Other Revenue | 69 | - | 295 | - |
| Operating expenses (includes charter hire expenses) | 12,867 | 10,928 | 35,996 | 32,840 |
| Net voyage revenues | 24,117 | 36,663 | 103,195 | 70,996 |
| Depreciation and amortization | 8,311 | 4,558 | 23,132 | 12,100 |
| General and administrative expenses | 3,057 | 2,817 | 8,902 | 8,528 |
| (Gain) loss on disposal/write down of vessels-net | (41) | 1,432 | (19,550) | 14,051 |
| Operating income (loss) | 12,790 | 27,856 | 90,711 | 36,317 |
| Loss on disposal/write down of investments |
(1,117) | - | (1,617) | (536) |
| Interest expense | (4,455) |
(7,817) | (15,678) | (20,404) |
| Interest income | 413 | 743 | 1,696 | 2,094 |
| Other-net | (67) | 588 | 255 | 2,213 |
| Equity (loss) in operations of joint ventures | - | 1,005 | 220 | 2,049 |
| Net income (loss) | $ 7,564 |
$ 22,375 | $ 75,587 | $ 21,733 |
| Basic earnings (loss) per share: | $ 0.11 | $ 0.38 | $ 1.13 | $ 0.39 |
| Diluted earnings (loss) per share: | $ 0.11 | $ 0.38 | $ 1.13 | $ 0.39 |
| Weighted average shares outstanding-basic |
70,244 | 59,211 | 66,597 | 55,749 |
| Adjusted EBITDA | $ 21,060 |
$ 33,846 | $ 94,293 | $ 62,468 |
|