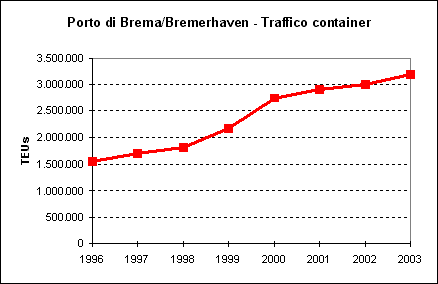
 Nel 2003 il porto di Brema/Bremerhaven ha registrato un traffico merci di 48.973.000 tonnellate, con un incremento del 5,2% rispetto all'anno precedente. Il comparto delle merci varie ha totalizzato 38.343.000 tonnellate (+4,8%), di cui 31.802.000 tonnellate in container (+6,0%) e 6.541.000 tonnellate di merci convenzionali (-0,5%). La movimentazione container ha toccato la quota record di 3.190.707 teu, con una progressione del 6,4% sull'anno precedente. Nel 2003 il porto di Brema/Bremerhaven ha registrato un traffico merci di 48.973.000 tonnellate, con un incremento del 5,2% rispetto all'anno precedente. Il comparto delle merci varie ha totalizzato 38.343.000 tonnellate (+4,8%), di cui 31.802.000 tonnellate in container (+6,0%) e 6.541.000 tonnellate di merci convenzionali (-0,5%). La movimentazione container ha toccato la quota record di 3.190.707 teu, con una progressione del 6,4% sull'anno precedente.
Il traffico delle rinfuse liquide è ammontato a 1.932.000 tonnellate (+24,6%), quello delle rinfuse secche a 8.698.000 tonnellate (+3,2%).
Maritime Traffic* in Bremen/Bremerhaven
January - December 2003
Provisional figures
Unit: Gross weight in 1,000 metric tons
(Source: Senator for Economic Affairs and Ports)
Incoming Goods |
January - December
2002 |
January - December
2003 |
Change
in % |
Liquid bulk |
1.507 |
1.874 |
+24,4 |
Dry bulk |
7.895 |
8.013 |
+1,5 |
Subtotal bulk |
9.402 |
9.887 |
+5,2 |
Containers |
14.005 |
14.776 |
+5,5 |
Other general cargo |
2.539 |
2.485 |
-2,1 |
subtotal general cargo |
16.544 |
17.261 |
+4,3 |
Total |
25.946 |
27.148 |
+4,6 |
| |
|
|
|
Outgoing Goods |
January - December
2002 |
January - December
2003 |
Change
in % |
Liquid bulk |
43 |
58 |
+34,9 |
Dry bulk |
537 |
685 |
+27,6 |
Subtotal bulk |
580 |
743 |
+28,1 |
Containers |
15.999 |
17.026 |
+6,4 |
Other general cargo |
4.033 |
4.056 |
+0,6 |
subtotal general cargo |
20.032 |
21.082 |
+5,2 |
Total |
20.612 |
21.825 |
+5,9 |
| |
|
|
|
Incoming/Outgoing Goods |
January - December
2002 |
January - December
2003 |
Change
in % |
Liquid bulk |
1.550 |
1.932 |
+24,6 |
Dry bulk |
8.432 |
8.698 |
+3,2 |
Subtotal bulk |
9.982 |
10.630 |
+6,5 |
Containers |
30.004 |
31.802 |
+6,0 |
Other general cargo |
6.572 |
6.541 |
-0,5 |
subtotal general cargo |
36.576 |
38.343 |
+4,8 |
Total |
46.558 |
48.973 |
+5,2 |
| |
|
|
|
Containers (TEU) |
2.998.598 |
3.190.707 |
+6,4 |
Maritime Traffic at Bremen/Bremerhaven
1990 - 2003
(Source: Statistical Office Bremen and Terminals)
| |
1990 |
1995 |
1999 |
2000 |
2001 |
2002 |
2003# |
Total Traffic |
30,204 |
31,071 |
36,036 |
44,770 |
46,029 |
46,519 |
48,973 |
Discharged |
18,847 |
19,069 |
21,066 |
25,688 |
25,894 |
25,847 |
27,148 |
Loaded |
11,357 |
12,002 |
14,970 |
19,082 |
20,135 |
20,672 |
21,825 |
| |
|
|
|
|
|
|
|
Bulk Cargo |
10,739 |
10,467 |
8,950 |
10,939* |
10,024* |
9,365 |
10,630 |
Liquid Bulk |
2,665 |
2,285 |
1,676 |
1,893 |
1,511 |
1,496 |
1,932 |
Dry Bulk |
8,074 |
8,182 |
7,274 |
9,046* |
8,513* |
7,869 |
8,698 |
Cereals/Cattlefeed |
1,608 |
1,822 |
0,688 |
0,724 |
0,577 |
0,554 |
|
Ores (discharged) |
4,722 |
4,253 |
3,862 |
4,923 |
4,899 |
4,487 |
|
Coal |
0,743 |
0,823 |
1,135 |
1,389 |
1,396 |
1,447 |
|
| |
|
|
|
|
|
|
|
General Cargo |
19,465 |
20,604 |
27,086 |
33,831* |
36,005* |
37,154 |
38,343 |
non containerized |
8,035 |
5,484 |
5,158 |
6,109* |
6,529* |
6,867 |
6,541 |
Fruit (discharged) |
0,771 |
0,469 |
0,360 |
0,396 |
0,400 |
0,442 |
|
Forest products |
1,831 |
1,039 |
0,963 |
1,039 |
1,025 |
1,113 |
|
Steel |
2,378 |
1,718 |
1,242 |
2,060 |
1,975 |
1,792 |
|
Containers
(Gross weight)*** |
11,430 |
15,120 |
21,928 |
27,722 |
29,476 |
30,287 |
31,802 |
| |
|
|
|
|
|
|
|
Containers (Number) |
777,970 |
957,027 |
1,335,350 |
1,653,122 |
1,769,411 |
1,797,883 |
1,899,873 |
Containers (TEU**) |
1,197,775 |
1,518,206 |
2,201,210 |
2,751,793 |
2,972,882 |
3,031,587 |
3,190,707 |
Vehicles (Number) |
706,853 |
802,544 |
1,119,964 |
1,099,986 |
1,221,752 |
1,417,995 |
1,349,645 |
| |
|
|
|
|
|
|
|
See-going Vessels
excluding passenger ships |
9,280 |
8,011 |
8,719 |
9,205 |
8,637 |
8,719 |
|
Cargo per ship
in tons |
3,255 |
3,878 |
4,133 |
4,864 |
5,329 |
5,335 |
|
Gross Tonnage (GT)
in 1000 |
79,978 |
89,454 |
117,937 |
130,280 |
134,000 |
135,808 |
|
*corrected final figures
** TEU = Twenty feet equivalent-units
*** Tare weight 5,954 Mio tons in 2001 and 6,067 Mio. tons in 2002
# provisional figures
|

|
|