Nel 2006 il traffico delle merci nel porto di New York - New Jersey si è attestato complessivamente a 86.162.562 tonnellate, con una progressione dell'1,7% rispetto all'anno precedente. Le merci varie sono ammontate a 31.194.421 tonnellate (+10,9%). . Nel 2006 il traffico delle merci nel porto di New York - New Jersey si è attestato complessivamente a 86.162.562 tonnellate, con una progressione dell'1,7% rispetto all'anno precedente. Le merci varie sono ammontate a 31.194.421 tonnellate (+10,9%). .
In calo invece le rinfuse, che hanno totalizzato 54.968.141 tonnellate (-2,9%). La diminuzione - ha spiegato oggi la port authority dello scalo americano - è stata determinata principalmente alla flessione del traffico di prodotti petroliferi raffinati.
In forte crescita la movimentazione di autoveicoli, che lo scorso anno è stata pari a 852.297 unità (+18%).
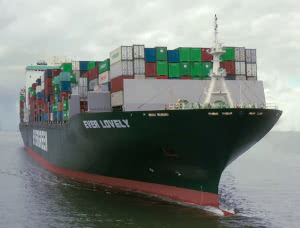
Nel 2006 il porto è stato scalato da 5.577 navi, rispetto a 5.322 nell'anno precedente.
Port of New York and New Jersey
2006
Trade Statistics
Source: U. S. Department of Commerce, Bureau of Census
General Cargo Tonnage
(Metric Tons) |
2005 |
2006 |
% Change
Over 2005 |
| |
|
|
|
Imports |
20,236,519 |
22,126,272 |
9.3% |
Exports |
7,895,978 |
9,068,149 |
14.8% |
Total |
28,132,497 |
31,194,421 |
10.9% |
| |
|
|
|
Bulk Cargo Tonnage |
|
|
|
Imports |
53,449,638 |
49,168,042 |
-8.0% |
Exports |
3,171,888 |
5,800,099 |
82.9% |
Total |
56,621,526 |
54,968,141 |
-2.9% |
| |
|
|
|
Total Cargo Tonnage |
84,754,023 |
86,162,562 |
1.7% |
| |
|
|
|
| |
|
|
|
Dollar Value of Cargo
(000's of $) |
2005 |
2006 |
% Change
Over 2005 |
| |
|
|
|
General Cargo Imports |
$85,229,701 |
$93,123,152 |
9.3% |
General Cargo Exports |
$25,743,872 |
$31,169,415 |
21.1% |
Total General Cargo |
$110,973,573 |
$124,292,567 |
12.0% |
| |
|
|
|
Bulk Imports |
$20,289,367 |
$22,980,635 |
13.3% |
Bulk Exports |
$1,145,403 |
$2,400,445 |
109.6% |
Total Bulk |
$21,434,770 |
$25,381,080 |
18.4% |
| |
|
|
|
Total Value |
$132,408,343 |
$149,673,647 |
13.0% |
| |
|
|
|
| |
|
|
|
Container Trade |
2005 |
2006 |
% Change
Over 2005 |
Loaded Import TEUs* |
2,408,121 |
2,599,554 |
7.9% |
Loaded Export TEUs* |
976,882 |
1,051,372 |
7.6% |
Total, Loaded TEUs |
3,385,003 |
3,650,926 |
7.9% |
| |
|
|
|
Total TEUS (loads and empties)** |
4,785,318 |
5,092,806 |
6.4% |
| |
|
|
|
Total Containers (loads and empties)** |
2,800,007 |
2,991,086 |
6.8% |
| |
|
|
|
| |
|
|
|
Vehicular Trade |
2005 |
2006 |
% Change |
Imports |
578,694 |
690,636 |
19% |
Exports |
143,717 |
161,661 |
12% |
Totals |
722,411 |
852,297 |
18% |
| |
|
|
|
Market Share, Loaded TEUs |
2005 |
2006 |
% Change |
North Atlantic Share |
58.4% |
|
|
* Source: Journal of Commerce - PIERS
** Port Authority of New York & New Jersey Facility Counts
Leading Trading Partners
via NY/NJ Customs District
(General Cargo in Metric Tons)
2006 Total Volume (imports/exports) Top 10 Trading Partners |
Rank |
Country |
% of
NY/NJ
Trade |
1 |
China |
22.99 |
2 |
Italy |
6.41 |
3 |
India |
6.36 |
4 |
Germany |
6.24 |
5 |
Brazil |
4.49 |
6 |
Japan |
4.38 |
7 |
Netherlands |
3.41 |
8 |
United Kingdom |
2.82 |
9 |
France |
2.76 |
10 |
Spain |
2.26 |
| |
|
|
2006 Import Volume Top 10 Trading Partners |
Rank |
Country |
% of
NY/NJ
Trade |
1 |
China |
20.87 |
2 |
Italy |
8.07 |
3 |
Germany |
7.59 |
4 |
India |
6.43 |
5 |
Brazil |
5.35 |
6 |
Japan |
4.09 |
7 |
Netherlands |
3.67 |
8 |
France |
3.33 |
9 |
Spain |
2.57 |
10 |
Thailand |
2.39 |
| |
|
|
2006 Export Volume Top 10 Trading Partners |
Rank |
Country |
% of
NY/NJ
Trade |
1 |
China |
28.17 |
2 |
India |
6.21 |
3 |
Japan |
5.09 |
4 |
United Kingdom |
4.04 |
5 |
South Korea |
2.98 |
6 |
Germany |
2.95 |
7 |
Netherlands |
2.79 |
8 |
Belgium |
2.60 |
9 |
Hong Kong |
2.41 |
10 |
Brazil |
2.38 |
Leading Growth Trading Partners
via NY/NJ Customs District
(General Cargo in Metric Tons)
Leading Import Trading Partners by Growth in 2006: |
Country |
Growth
Rank |
Growth
Over 2005 |
Top Commodities |
Austria |
1 |
49.11% |
Beverages, Paper/Paperboard, Vehicles, Machinery, and Plastics |
Netherlands |
2 |
32.50% |
Beverages, Milling/Malt /Starch, Cocoa, Paper/Paperboard, and Live Trees & Plants |
Japan |
3 |
25.11% |
Vehicles, Machinery, Organic Chemicals, Salt/Sulfur/Earth/Stone, and Plastics |
India |
4 |
20.46% |
Salt/Sulfur/Earth/Stone, Stone/Plaster/Cement, Plastics, Iron/Steel Products, and Machinery |
Sweden |
5 |
19.24% |
Iron and Steel, Vehicles, Machinery, Wood Pulp, etc., and Paper/Paperboard |
Leading Export Trading Partners by Growth in 2006: |
Country |
Growth Rank |
Growth Over 2005 |
Top Commodities |
Japan |
1 |
74.58% |
Salt/Sulfur/Earth/Stone, Paper/Paperboard, Organic Chemicals, Wood, and Plastics |
Venezuela |
2 |
46.40% |
Wood Pulp, Machinery, Vehicles, Miscellaneous Chemical Products, and Plastics |
Hong Kong |
3 |
35.97% |
Plastics, Paper/Paperboard, Wood, Tanning/Dye/Paint/Putty, and Iron/Steel |
Belgium |
4 |
26.44% |
Plastics, Tanning/Dye/Paint/Putty, Ores/Slag/Ash, Miscellaneous Chemical Products, and Paper/Paperboard |
Russia |
5 |
20.83% |
Vehicles, Meat, Machinery, Miscellaneous Chemical Products, and Rubber |
Source: U. S. Department of Commerce, Bureau of Census
Port of NY/NJ
Share of Total U.S. General Cargo
2006 Top 10 Trading Partners by Value (Millions of US Dollars) |
Rank |
Country |
2005
PONYNJ
Amount |
PONYNJ
% of
US Total |
2006
PONYNJ
Amount |
PONYNJ
% of
US Total |
0 |
World |
$110,974 |
13.71% |
$124,293 |
13.69% |
1 |
China |
$16,108 |
8.14% |
$18,874 |
8.09% |
2 |
Japan |
$9,833 |
8.38% |
$11,750 |
9.17% |
3 |
Germany |
$10,858 |
18.44% |
$11,161 |
17.56% |
4 |
Italy |
$6,933 |
36.44% |
$7,563 |
37.14% |
5 |
United Kingdom |
$6,524 |
23.32% |
$7,127 |
24.37% |
6 |
France |
$4,701 |
28.86% |
$4,857 |
28.25% |
7 |
India |
$3,827 |
29.55% |
$4,579 |
29.59% |
8 |
Netherlands |
$3,515 |
27.08% |
$3,810 |
26.64% |
9 |
Brazil |
$3,338 |
16.80% |
$3,759 |
17.10% |
10 |
South Korea |
$3,085 |
8.97% |
$3,095 |
8.32% |
Port of NY/NJ
Share of Total U.S. General Cargo
2006 Top 10 Trading Partners by Volume (1000 Metric Tons) |
Rank |
Country |
2005
PONYNJ
Amount |
PONYNJ
% of
US Total |
2006
PONYNJ
Amount |
PONYNJ
% of
US Total |
0 |
World |
28,132 |
11.28% |
31,194 |
11.32% |
1 |
China |
6,358 |
10.13% |
7,172 |
9.55% |
2 |
Italy |
1,809 |
27.03% |
2,001 |
29.09% |
3 |
India |
1,672 |
29.30% |
1,985 |
29.81% |
4 |
Germany |
1,699 |
16.99% |
1,946 |
18.24% |
5 |
Brazil |
1,357 |
11.66% |
1,399 |
12.10% |
6 |
Japan |
987 |
5.16% |
1,366 |
6.51% |
7 |
Netherlands |
864 |
18.63% |
1,065 |
20.19% |
8 |
United Kingdom |
837 |
17.06% |
879 |
18.45% |
9 |
France |
819 |
21.60% |
862 |
22.75% |
10 |
Spain |
654 |
18.68% |
705 |
19.35% |
Source: U. S. Department of Commerce, Bureau of Census
|
|