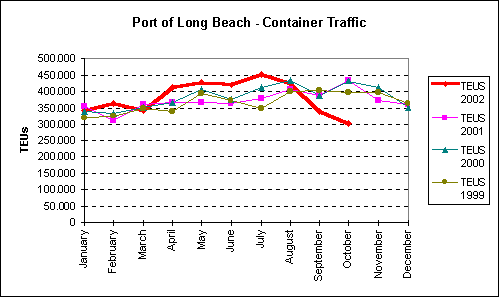
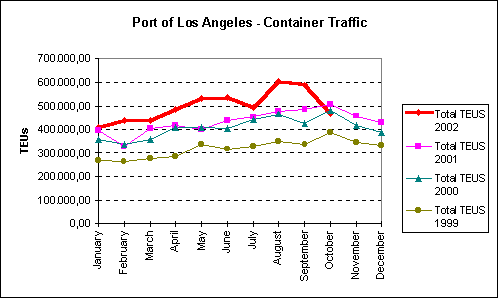
 Nello scorso ottobre il traffico container nei porti di Long Beach e Los Angeles è calato rispettivamente del 30,7% e del 6,7%, attestandosi a 201.318 teu e 470.971 teu. La diminuzione del traffico a Long Beach è stata consistente sia per le importazioni (-31,2%) che per le esportazioni (-50,6%) di container pieni; la movimentazione di container vuoti è scesa del 15,3%. Nello scorso ottobre il traffico container nei porti di Long Beach e Los Angeles è calato rispettivamente del 30,7% e del 6,7%, attestandosi a 201.318 teu e 470.971 teu. La diminuzione del traffico a Long Beach è stata consistente sia per le importazioni (-31,2%) che per le esportazioni (-50,6%) di container pieni; la movimentazione di container vuoti è scesa del 15,3%.
Altrettanto è accaduto a Los Angeles, dove le importazioni e le esportazioni di container pieni sono diminuite rispettivamente del 4,8% e del 22,7%; in lieve calo anche la movimentazione di container vuoti (-0,4%).
Port of Long Beach
Container Trade in TEUs*
Based on Preliminary Figures
(Source: Port of Long Beach)
| | LOADED | TOTAL | TOTAL | TOTAL |
| | Inbound | Outbound | LOADED | EMPTIES | CONTAINERS |
| Oct-02 | 163,776 | 40,608 | 204,384 | 96,934 | 301,318 |
| Oct-01 | 238,185 | 82,255 | 320,440 | 114,428 | 434,868 |
| % change | -31.2% | -50.6% | -36.2% | -15.3% | -30.7% |
| Jan-02 | 180,528 | 70,944 | 251,472 | 93,173 | 344,645 |
| Feb-02 | 202,276 | 83,334 | 285,610 | 77,373 | 362,983 |
| Mar-02 | 171,874 | 87,845 | 259,719 | 83,887 | 343,606 |
| Apr-02 | 227,953 | 87,961 | 315,914 | 94,286 | 410,200 |
| May-02 | 231,382 | 84,062 | 315,444 | 112,589 | 428,033 |
| Jun-02 | 236,112 | 75,814 | 311,926 | 107,051 | 418,977 |
| Jul-02 | 249,618 | 70,499 | 320,117 | 131,800 | 451,917 |
| Aug-02 | 234,592 | 71,086 | 305,678 | 121,558 | 427,236 |
| Sep-02 | 188,674 | 53,840 | 242,514 | 97,825 | 340,339 |
| Oct-02 | 163,776 | 40,608 | 204,384 | 96,934 | 301,318 |
| Jan '02-Oct '02 | 2,086,785 | 725,993 | 2,812,778 | 1,016,476 | 3,829,254 |
| Jan '01-Oct '01 | 2,035,242 | 793,306 | 2,828,548 | 902,791 | 3,731,339 |
| % change | 2.5% | -8.5% | -0.6% | 12.6% | 2.6% |
*TEUs: 20-foot equivalent units or 20-foot-long cargo container
 Port of Los Angeles Port of Los Angeles
Monthly container count
in twenty-foot equivalent units (TEUs)
(Source: Port of Los Angeles)
| October | 2002
| 2001 | Change |
Percent
Change |
| Loaded Inbound | 252,909.65 | 265,721.70 | (12,812.05) |
-4.82% |
| Loaded Outbound | 70,208.40 | 90827.65 | (20,619.25) | -22.70% |
| Total Loaded | 323,118.05 | 356,549.35 | (33,431.30) |
-9.38% |
| Total Empty | 147,852.55 | 148,470.75 | (618.20) | -0.42% |
| |
| Total | 470,970.60 |
505,020.10 | (34,049.50) | -6.74% |
| | | | | |
| Fiscal Year (to date) | 2,161,397.00 | 1,918,589.00 | 242,808.00 |
12.66% |
| Calendar Year (to date) | 4,993,181.80 | 4,300,326.00 | 692,855.80 |
16.11% |
| Notes: |
| 1. Inbound = import. Outbound = export.
|
| 2. TEUs = twenty-foot equivalent units, a standardized maritime industry measurement used when counting cargo containers of varying lengths.
|
| 3. Fiscal year begins July 1.
|
| 2002 Statistics: |
| Month | In Loaded
| In Empty | In Total
| % Empty | OB Loaded
| OB Empty | OB Total
| % Empty | Total TEUS
| Prior Year % Change |
| January | 210,394.25 |
10,415.00 | 220,809.25 | 4.72% | 83,122.55 | 104,304.65 | 187,427.20 | 55.65% | 408,236.45 | 2.83% |
| February | 234,405.15 |
9,761.60 | 244,166.75 | 4.00% | 92,400.75 | 98,440.20 | 190,840.95 | 51.58% | 435,007.70 | 31.65% |
| March | 218,697.50 |
11,256.20 | 229,953.70 | 4.89% | 92,662.25 | 113,949.75 | 206,612.00 | 55.15% | 436,565.70 | 8.70% |
| April | 258,026.40 |
9,346.35 | 276,372.75 | 3.50% | 91,114.35 | 125,812.15 | 216,926.50 | 58.00% | 484,299.25 | 16.02% |
| May | 274,449.30 | 9,935.20 | 284,384.50 | 3.49% | 96,684.70 | 150,145.00 | 246,829.70 |
60.83% | 531,214.20 | 32.80% |
| June | 291,966.30 |
9,480.65 | 301,446.95 | 3.15% | 95,285.10 | 139,729.45 | 235,014.55 | 59.46% | 536,461.50 | 23.25% |
| July | 260,811.15 |
11,120.95 | 271,932.10 | 4.09% | 83,739.65 | 140,018.70 | 223,758.35 | 62.58% | 495,690.45 | 9.70% |
| August | 327,471.85 |
12,217.40 | 339,689.25 | 3.60% | 91,421.45 | 174,383.10 | 265,804.55 | 65.61% | 605,493.80 | 26.92% |
| September | 320,577.65 | 10,388.80 | 330,966.45 | 3.14% | 89,503.25 | 168,772.45 | 258,275.70 | 65.35% | 589,242.15 | 21.58% |
| October | 252,909.65 |
12,307.70 | 265,217.35 | 4.64% | 70,208.40 | 135,544.85 | 205,753.25 | 65.88% | 470,970.60 | -6.74% |
| |
| Total CY 2002 | 2,649,709.20 | 106,229.85 | 2,755,939.05 |
3.85% | 886,142.45 | 1,351,100.30 | 2,237,242.75 | 60.39% | 4,993,181.80 | 16.11% |
| FY 2003 July '02- June '03 | 1,161,770.30 | 46,034.85 | 1,207,805.15 |
3.81% | 334,872.75 | 618,719.10 | 953,591.85 | 64.88% | 2,161,397.00 | 12.66% |

|
|