The Dry Bulk market
in 2000 |
|
The year 2000 has
been one to remember. After two difficult years, this year has been
witness to remarkable rate increases achieving levels that had not been
seen for five years. Almost all sectors of the shipping industry have
seen the same story except chemical, ro-ro and reefer ships.
|
| The freight market |

|
|
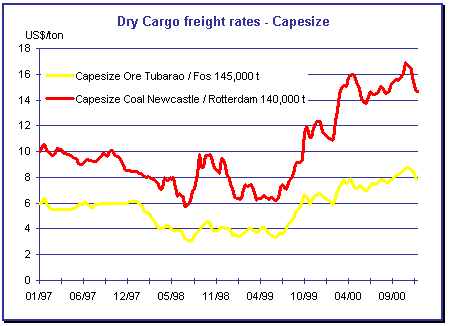
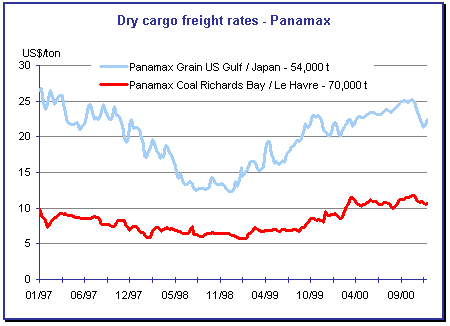
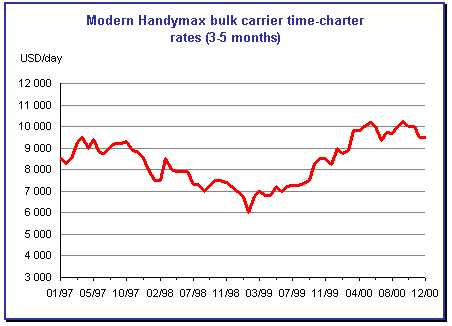
In dry cargo, all sizes have reaped the benefits.
Within one year the Baltic Dry Index has recorded an increase of 23 % (a
rise which began in-mid 1999) after a high of 30 % in November. The rise
of the Panamax index has been more modest (15 %), in line with that of
the Handymax (17 %). The time-charter 12 month rates have gone from an
average daily rate of $ 7,600 in 1998 to $ 7,300 in 1999 to reach $
11,300 in the year 2000, i.e. 47 % increase. The Handymax vessels have
seen their revenues increase by 30 % during the period, from $ 7,600 in
1998 to $ 7,300 in 1999 to $ 9,600 daily average in 2000. As to the
Capesize, they have seen the most spectacular rise as after two years
averaging around $ 10,000 they have seen an average return of $ 20,000
per day this year.


|
| The fleet |

|
|
These figures should be taken in the context of the
world fleet statistics on the one hand and the world trade figures on
the other.
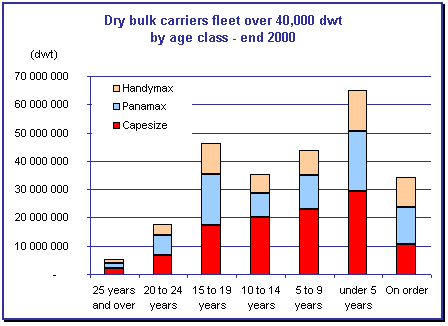
An analysis of the fleet shows a net reduction in
numbers of deliveries compared with previous years. Fourty-one Capesize
have been delivered in 2000 (around 6 million dwt), 62 Panamax (4.6
million dwt) and 92 Handysize (3.4 million dwt). However it is
interesting to note that the fleet, all sizes combined, did not increase
during the 1998-1999 period. Taking into account a very low level of
scrapping, the Capesize and Panamax size fleets have increased by only
about 6 % in 2000 and a modest 2 % in the Handysizes.
Contrary to this, the number of deliveries for 2001
and to a lesser extent for 2002 is likely to have a greater impact on
the markets in the months / years to come with 34 Capesize (5.4 m. dwt),
108 Panamax (8 m. dwt) and 167 Handysize (7 m. dwt) being delivered next
year. In this respect the age structure of the present fleet leaves
little hope of an adjustment by demolition.

|
| The demand |

|
|
According to the World Trade Organisation, world
trade during 2000 has risen by more than 10 % (the highest rate in the
last 10 years) due primarily to a strong uptake of activity in western
European countries and Asia. Still according to the WTO, world trade for
2001 should grow at a slower pace but still in excess of the 6.5 %
average seen over the last 10 years.
Prices of commodities have been increasing since 1999
(notably oil) and this trend has continued during 2000. The iron ore and
steel trades which had lost 10 % of their value in 1999 compared with
1998 have seen an increase in demand and consequently in prices this
year.
China has been the first beneficiary from the
recovery of the Asian economies and has had excellent results on the
exports side in particular with steam and coking coal to India which has
become their first importer but also to South Korea and Japan. The Asian
dragons have more or less overcome the effects of the 1997-98 crisis and
have seen a healthy internal demand (although remaining fragile). Since
the first quarter of 2000, Indonesian coal exports to Europe have
increased by 5 % compared with the first quarter of 1999.
Due to restrictions in Indonesian ports, Panamax and
Handysize vessels have been the first to profit.
The United-States and Europe have continued to see a
strong internal demand. The sharp rise in oil prices has most likely had
the effect of increasing coal demand which has resulted in a growth of
Australian, South-African and Colombian exports whilst American exports
have decreased by 15 % during the first 9 months of the year.
There have been similar developments in bulk iron ore
cargoes particularly Brazilian exports. According to industry sources
about 440 million tons of iron ore were shipped in 2000, some 30 mt more
than in 1999 (as a reminder, one Capesize vessel transports about 1.3 mt
per year). Predictions for the next five years have iron ore shipments
up by 6.5 % to reach 470 mt by 2005.
European crude steel production, according to IISI
(International Institute for Steel Industry), increased from 155 mt in
1999 to 163 mt in 2000. American production increased from 96 mt in 1999
to 101 mt in 2000. Over the same period Japanese output climbed to 106
mt, against 94 mt a year before. Asia in general terms saw production
levels increase to 319 mt (compared with 298 mt in 1999).
The level of grain trades for the 1999 / 2000 season
has remained relatively stable at 211,000 tons.
The International Grain Council (IGC) foresees
similar figures for the season 2000 / 2001. According to them, Eastern
Europe, Saudi Arabia, China and North Africa should all increase imports
during the current season.
As to the minor bulks, fertilisers continue to be
negatively affected by environmental concerns. The improved agricultural
production in India as well as in Argentina and Brazil has avoided a
crisis in this sector.
Strong American domestic demand for cement and
clinker has boosted Asian exports, principally transported by Handysize
vessels. However, these exports should decrease due to weaker American
demand and an increasing local consumption.
Doubts about bulk market strength can be entertained
when we consider the slowdown in the world economy's growth rate
especially in the USA and western Europe as well as the slow recovery of
the Japanese economy. Economic analysts seem to agree that the year 2000
was a high point in world economic growth. Steel prices (after a record
high) have reached their lowest point in the last two years and a number
of steel mills anticipate a reduction of their steel production as the
industry enters into what would seem to be the bottom of the cycle. One
should not overlook either, the impact of the anti-dumping measures in
the coming year and the resulting closure of the American markets to
Asian products. The overcapacity which will follow will have its own
impact on the prices. If Asian production is absorbed by local markets
there will be a reduction of volume in ton miles compared to the
previous year.
The situation does not, however, seem so critical if
we take into consideration that according to the OECD figures, world
growth should be 3.75 % in 2001 and 3 % in 2002. Certainly the number of
new deliveries this year could be seen as troubling, in particular in
the Panamax and Handymax sizes. But only 34 Capesize vessels will be
delivered representing a little more than 6 % of the existing fleet.
Furthermore after the sinking of the 'Erika' and
then the 'Ievoli Sun' many charterers have now put into place
quality procedures aimed at eliminating "risky" vessels in
advance the European Union political decisions to be taken
One could thus hold that the constraints for old
vessels or sub-standard vessels will lead to their quick elimination
from the world fleet.
Moreover the policies of consolidation in the sector
have multiplied as illustrated by the change of shareholding capital of
certain owners. We can cite the withdrawal of Old Mutual from Safmarine,
the disengagement of Krupp Stahl in Krupp Shipping and the sale of
P&O Bulk to the Ofer Brothers group company Zodiac. Pooling
agreements have been concluded between Bocimar and Klaveness for their
Capesize and Panamax fleets and Bocimar and AP Moller for their Capesize
fleets. It can only be assumed that these rationalisations will not be
without some impact on market control.
The outlook for 2001 is even harder than normal to
predict. The ambivalent expectations of the operators also provide a
fair share of uncertainties.
The energy groups handling more and more complex
tools to cover their risks, are increasingly using the spot market to
deal with the physical transportation of coal. At the same time steel
mills have a low contract coverage for 2001, although at this stage it
is too early to say whether this is due to a real "soft
landing" or to downward revision of the iron ore and coal imports.
We could imagine a year filled with "squeeze and
ease" situations with a number of import elements external to the
marine industry having a strong influence : exchange rates, interest
rates, oil prices.
More than ever, nothing is yet decided.
 |
SHEILA ANN
70,037 dwt - self unloader, built 1999 by Jiangnan - Owned by Canada Steamship Lines |
|
|
The bulk carrier second-hand
market
|
|
| The Capesize second-hand
market (80,000 dwt and over) |

|
|
In the course of the last twelve months, following
the trend within the charter market, Capesize second-hand values have
kept up their end 1999's momentum but with as usual some exceptions.
Throughout the year buyers have been eager to take advantage of hefty
trading profits. However, the top of the market was reached in October.
Since then a softening has been noticed, reflecting buyers' lack of
enthusiasm as they had mixed feelings concerning 2001 developments.
Thus, with a decline in potential buyers competing on each vessel,
prices began to slide.
The firming-up of charter rates and a rise in
newbuilding prices have steadily enticed sellers towards the second-hand
market. Attracted by some good prices reported, they were convinced to
reach the same levels. This appeared afterwards to be over-optimistic
and not always in line with each vessels' genuine commercial or
technical characteristics. This phenomenon has led to the withdrawal of
five or six units from the sale and purchase market. However, these
owners can count on reaping some good gains in chartering the unsold
vessels, enabling them to depreciate book-values, thereby creating
potential profit for the future.
In the Capesize segment, about 27 confirmed
"individual" deals "for further trading" have been
reported. However, one should of course add the purchase by Zodiac, the
bulk shipping arm of the Samy Ofer group, of the entire P&O bulk
fleet, which includes 18 owned Capes.
Only 8 vessels left the scene for the scrapyards.
Out of the above mentioned 27 deals, 16 were
completed on mid-eighties built units, while 9 applied to vessels from
1990 onwards (including two promptly deliverable resales) and only two
related to ships assembled in the seventies. Two transactions have been
concluded in the form of bareboat charters, and one was in fact a
refinancing deal conducted by Japanese operators.
Greek buyers were quite active as they took 19 of
them, the rest being evenly spread between other nationalities.
At the end of the year our feeling was that price
levels had gone back to more or less where they started a year ago. On
the basis of vessels 'fully classed' and in good working order
(which may represent a substantial addition to the price compared to
levels fetched by most market candidates), the following values should
apply :

Market observers will look at next year's
developments with the utmost interest, bearing in mind that whereas the
Capesize orderbook remains reasonable compared to the large number of
Panamax on order, world economic growth is likely to soften inducing a
probable decrease of seaborne trades.
Cautiousness might be the name of the game.
|
| The
second-hand Panamax & Handymax bulk carrier market |

|
|
The year 2000 started with wishes that world trade
and economy growth would continue as they ended 1999. This was indeed
the case but, on the eve of the new millennium, it seems that a slowdown
in growth is around the corner if not already upon us.
The average charter rates for the size of ships under
consideration peaked and were significantly higher than in the past
couple of years. However, as the year drew to its end, rates seem to be
under pressure, thus changing the mood of potential buyers. Those owners
who considered selling tonnage hoping they would do so in similar
conditions (intense buying interest leading to ever increasing prices)
as last year, were disillusioned. The great number of ships offered for
sale not only gave buyers a large choice but also created a limited
competition and kept prices under control.
When compared to 1999, there were about :
- 26 % less Panamax sales (54 ships in 2000 against 73 in 1999)
- 17-18 % less Handymax sales (70 ships in 2000 against 85 in 1999)
The reasons for this may be summarised as follows :
- The large number of newbuilding orders placed in 1999 as well as
during 2000, especially in the Panamax and Handymax size sectors
(about 20 % of the Panamax and Handymax existing fleet is currently
on order), has resulted in a subdued buying interest for second-hand
bulk carrier tonnage of such particular sizes.
- Most of the ships contracted during 1999 and 2000 are being
delivered now and will continue throughout 2001.
- The estimated number of vessels in the Panamax size scheduled for
delivery during 2001 is over 100 units, i.e. about two Panamax bulk
carriers per week'
- Similarly for the Handymax size, an estimated number of two to
three ships per week will be delivered during 2001.
- The number of ships sold for demolition is significantly lower
than last year, demolition activity, during 2000, in the Panamax
size is down by about 85 % and the respective reduction in scrapping
concerning the Handymax size for the same period is about 10 %.
In addition to the above, other reasons such as human
nature is significant as well. As commented in our review for 1999, the
feeling "now is the time to buy", was simply not possible
during the last 12 months. Aggressive players made their moves during
1999 and successful buyers during this time became "interested
spectators" in 2000. Potential buyers compared this year's
"expected" prices with last year's "actual" prices
and simply just waited until a seller became "serious"'
The bottom line of the year was the smaller number of
sale and purchase transactions. Greek buyers were, as usual, the most
active whereas the Japanese and Norwegian shipowning communities were
the major actors on the selling side.
In the second-hand bulk carrier market, a new factor
will be interesting to monitor this year, that is the listing of Greek
shipping companies on the Athens Stock Exchange.
 |
MED CARRARA
(ex-ICL Jaya Konda), 43,300 dwt, built 1981 by Kasado - Owned by Duke
Shipping Limited |
|
|
|

|
|
About 54 ships changed hands during the course of
2000. Sales were evenly spread over the year with a peak of activity in
October, when about 10 sales were reported.
Out of the total number of 54 vessels sold over 60 %
were 1980's built ships. Looking more closely, the breakdown can be
read as follows :
- 10 % (6 units) were built in the 1970's,
- 41 % (22) were built in the early 1980's (1980-1983),
- 12 % (7) were built in the mid 1980's (1984-1987),
- 10 % (6) in the late 1980's (1988-1989),
- 24 % (13) ships in the 1990's with the majority in the middle of
the decade (1994-1996).
After the frenzied increases in price recorded in
1999, prices of second-hand good quality Panamax bulk carriers remained
relatively steady over the period under consideration with a softening
tendency over the last few months. As the year draws to an end, we
assume that all age segments of the Panamax bulk carrier sale and
purchase market will feel a downward pressure on values, especially for
the 1980's built tonnage.
At the time of writing a 10 year old Panamax bulk
carrier is worth somewhere in the region of $11.5 million, whereas a
vessel having half her age is estimated at a value in the region of
$16.0 - 16.2 million.
One should not forget the significant number of
Panamax bulk carrier, firm or optional contracts, held by several owners
(Ugland, Brave Maritime, Diana Shipping, Embiricos, Chandris to name but
a few) who either resold, or transformed them into firm orders for
tankers (Aframax / Suezmax / VLCC) or even cancelled the options
altogether'
What will be the price in the early months of 2001?
Our feeling is that prices will ease off as the newbuildings are being
delivered and that charter rates will be under pressure.
Cautioun may be a keyword for 2001.
|
|
|

|
|
The total number of ships sold during the past 12
months dropped to 70, representing an overall 17-18 % decrease in the
number of reported transactions over last year.
Looking at the age of the ships sold, we notice that
50 % of these are 80's built tonnage, whereas about 30 % involved 90's
built ships. A closer study reveals the following age breakdown :
- 20 % (14 vessels) built in the 1970's,
- 14 % (10) built in the early 1980's (1980-1983),
- 31 % (22) built in the mid 80's (1984-1987),
- 6 % (4) built in the late 1980's (1988-1989),
- 6 % (4) built in the early 1990's (1990-1993),
- 16 % (11) built in the mid 1990's (1994-1997),
- 7 % (5) built in the late 1990's (1998-1999).
Similarly to the Panamax sector, prices peaked in
1999 and remained fairly steady this year. Whereas charter earnings
during 2000 were far better than last year, the increased number of
ships on offer for sale meant that potential buyers had a very large
choice. This resulted in prices not attaining new highs but rather
consolidating last year's levels.
At the time of writing, assuming a buyer is willing
to invest promptly in a 10 year old Handymax bulk carrier he will need
to pay about $11.5 million, whereas a similar ship of half this age is
currently worth about $15.5 million.
|
|

For how long will it last ?
At the beginning of the last quarter 2000, the
pressure on prices became noticeable especially for 1980's and early
1990's built ships. The orderbook figures have done their magic effect
again, and long period charters are not as forthcoming as they were
during 1999 or in the earlier part of 2000. Potential buyers are
cautious (who can blame them) and, as mentioned earlier, this may prove
to be a keyword for 2001.
To summarise, we believe that shipping industry
players may be "cautiously optimistic" for the near future
only if an accelerated demolition activity is re-established, coupled
with positive growth and world trade figures, having positive effects on
seaborne trades.
|
Shipping and Shipbuilding Markets in 2000
I N D E X
|