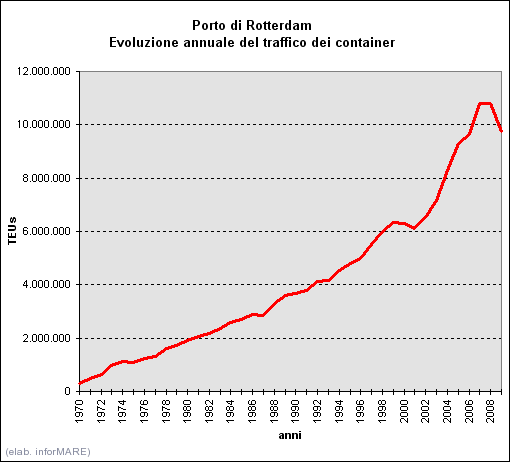
 La Port Authority di Rotterdam ha comunicato oggi i dati statistici definitivi del traffico delle merci registrato lo scorso anno dal porto olandese che mostrano un incremento di oltre un milione di tonnellate rispetto al dato provvisorio reso noto alla fine del 2009 (inforMARE del 30 dicembre 2009). . La Port Authority di Rotterdam ha comunicato oggi i dati statistici definitivi del traffico delle merci registrato lo scorso anno dal porto olandese che mostrano un incremento di oltre un milione di tonnellate rispetto al dato provvisorio reso noto alla fine del 2009 (inforMARE del 30 dicembre 2009). .-

- Throughput port of Rotterdam
-
Unit: Gross weight in 1,000 metric tons
-
(Source: Port of Rotterdam Authority)
-
|
2008 |
2009 |
Diff. |
Jan-Dec |
Jan-Dec |
in % |
|
|
|
|
Incoming |
|
|
|
Agribulk |
8.548 |
6.867 |
-19,7 |
Ores and scrap |
40.880 |
20.184 |
-50,6 |
Coal |
27.688 |
23.665 |
-14,5 |
Other dry bulk goods |
9.634 |
6.442 |
-33,1 |
Subtotal dry bulk goods |
86.750 |
57.158 |
-34,1 |
|
|
|
|
Crude oil |
100.068 |
95.676 |
-4,4 |
Mineral oil products |
36.246 |
42.241 |
16,5 |
Other liquid bulk goods |
22.908 |
18.070 |
-21,1 |
Subtotal liquid bulk goods |
159.222 |
155.987 |
-2,0 |
|
|
|
|
Total bulk goods |
245.972 |
213.145 |
-13,3 |
|
|
|
|
Containers |
52.865 |
47.890 |
-9,4 |
Roll on/Roll off |
9.009 |
8.025 |
-10,9 |
Other general cargo |
5.174 |
4.232 |
-18,2 |
Total general cargo |
67.048 |
60.147 |
-10,3 |
|
|
|
|
Total incoming |
313.020 |
273.292 |
-12,7 |
|
|
|
|
|
|
|
|
Outgoing |
|
|
|
Agribulk |
1.872 |
1.467 |
-21,6 |
Ores and scrap |
3.121 |
3.114 |
-0,2 |
Coal |
865 |
1.168 |
35,0 |
Other dry bulk goods |
2.327 |
3.721 |
59,9 |
Subtotal dry bulk goods |
8.185 |
9.470 |
15,7 |
|
|
|
|
Crude oil |
338 |
742 |
119,5 |
Mineral oil products |
22.330 |
29.949 |
34,1 |
Other liquid bulk goods |
12.113 |
11.412 |
-5,8 |
Subtotal liquid bulk goods |
34.781 |
42.103 |
21,1 |
|
|
|
|
Total bulk goods |
42.966 |
51.573 |
20,0 |
|
|
|
|
Containers |
54.134 |
52.390 |
-3,2 |
Roll on/Roll 0ff |
8.897 |
7.980 |
-10,3 |
Other general cargo |
2.119 |
1.722 |
-18,7 |
Total general cargo |
65.150 |
62.092 |
-4,7 |
|
|
|
|
Total outgoing |
108.116 |
113.665 |
5,1 |
|
|
|
|
|
|
|
|
Incoming and outgoing |
|
|
|
Agribulk |
10.420 |
8.334 |
-20,0 |
Ores and scrap |
44.001 |
23.298 |
-47,1 |
Coal |
28.553 |
24.833 |
-13,0 |
Other dry bulk goods |
11.961 |
10.163 |
-15,0 |
Subtotal dry bulk goods |
94.935 |
66.628 |
-29,8 |
|
|
|
|
Crude oil |
100.406 |
96.418 |
-4,0 |
Mineral oil products |
58.576 |
72.190 |
23,2 |
Other liquid bulk goods |
35.021 |
29.482 |
-15,8 |
Subtotal liquid bulk goods |
194.003 |
198.090 |
2,1 |
|
|
|
|
Total bulk goods |
288.938 |
264.718 |
-8,4 |
|
|
|
|
Containers |
106.999 |
100.280 |
-6,3 |
Roll on/Roll 0ff |
17.906 |
16.005 |
-10,6 |
Other general cargo |
7.293 |
5.954 |
-18,4 |
Total general cargo |
132.198 |
122.239 |
-7,5 |
|
|
|
|
Total throughput |
421.136 |
386.957 |
-8,1 |
- Incoming and outgoing containers/TEUs by classes of length
Unit: Number of containers/TEUs (Twenty feet Equivalent Unit)-
|
January - December 2008 |
January - December 2009 |
Number
empty |
Number
loaded |
Total |
Number
empty |
Number
loaded |
Total |
|
|
|
|
|
|
|
Incoming |
|
|
|
|
|
|
<29ft |
213.688 |
972.689 |
1.186.377 |
198.203 |
892.038 |
1.090.241 |
30-39ft |
18.517 |
14.744 |
33.261 |
17.747 |
7.025 |
24.772 |
40-44ft |
240.147 |
1.618.468 |
1.858.615 |
215.631 |
1.479.738 |
1.695.369 |
45>ft |
135.467 |
97.577 |
233.044 |
103.159 |
88.447 |
191.606 |
|
|
|
|
|
|
|
Total incoming: |
|
|
|
|
|
|
Number containers |
607.819 |
2.703.478 |
3.311.297 |
534.740 |
2.467.248 |
3.001.988 |
Number TEUs |
1.037.035 |
4.459.117 |
5.496.152 |
895.095 |
4.067.329 |
4.962.424 |
|
|
|
|
|
|
|
|
|
|
|
|
|
|
Outgoing |
|
|
|
|
|
|
<29ft |
226.394 |
893.770 |
1.120.164 |
176.155 |
889.241 |
1.065.396 |
30-39ft |
1.248 |
32.328 |
33.576 |
1.230 |
30.313 |
31.543 |
40-44ft |
503.729 |
1.284.780 |
1.788.509 |
377.160 |
1.230.323 |
1.607.483 |
45>ft |
10.561 |
221.357 |
231.918 |
8.969 |
184.735 |
193.704 |
|
|
|
|
|
|
|
Total incoming: |
|
|
|
|
|
|
Number containers |
741.932 |
2.432.235 |
3.174.167 |
563.514 |
2.334.612 |
2.898.126 |
Number TEUs |
1.260.264 |
4.027.409 |
5.287.673 |
953.071 |
3.827.795 |
4.780.866 |
|
|
|
|
|
|
|
|
|
|
|
|
|
|
Total throughput: |
|
|
|
|
|
|
Number containers |
1.349.751 |
5.135.713 |
6.485.464 |
1.098.254 |
4.801.860 |
5.900.114 |
Number TEU's |
2.297.299 |
8.486.526 |
10.783.825 |
1.848.166 |
7.895.124 |
9.743.290 |
|